
35 Shocking Sales Pipeline Statistics You Need To Know
Are you looking for the Sales Pipeline Statistics for 2024?
You are at the right place!
This is very crucial to have a managed sales pipeline to stay ahead in this fast-paced and highly competitive world of business.
It helps to create a roadmap that will guide your sales team through each stage of the customer journey that will eventually convert your leads into paying customers.
Today I have shared what I have got after a deep investigation of the sales pipeline that will help you to gain insights and make more informed decisions.
In this blog post, 50 sales pipeline statistics you will know everything about the latest trends, best practices and benchmarks in sales pipeline management.
So without further ado, let’s get started and discover the valuable data that can transform your sales strategy and ensures your business growth-
Key Takeaways:
- Nurturing leads results in 47% larger purchases and 50% more sales-ready leads at a 33% lower cost per lead.
- Strong sales and marketing alignment leads to a 20% annual growth rate, while poor alignment results in a 4% decline.
- Adopting CRM software increases revenue per salesperson by 41%.
- Reducing customer churn by 5% can boost profitability by 25% to 125%.
- Sales automation improves productivity by 14.5% and reduces sales administration time by 12.2%.
- Other Sales Pipeline Statistics 2024
- 1. Average Conversion Rate
- 2. Lead Response Time
- 3. Sales Cycle Lenght Stats
- 4. Sales Pipeline Value
- 5. Sales Pipeline Leakage
- 6. Sales Lead Source Effectiveness
- 7. Win Rate by Lead Source
- 8. Sales Pipeline Segmentation
- 9. Sales Pipeline Length by Industry
- 10. Sales Pipeline Alignment with Marketing
- 11. Sales Pipeline Benchmark Statistics
- 12. Sales Pipeline Follow Up Statistics
- 13. Impact of Upselling and Cross-selling
- 14. Sales Pipeline Visualization
- 21 Fact-Checked Sales Pipeline Stats 2024
- Conclusion
Other Sales Pipeline Statistics 2024
In this step, I will show you Sales pipeline stats in different customer journeys on your sales pages.
So what are you waiting for? Let’s start exploring-
1. Average Conversion Rate
Do you know there is a huge chance of converting one customer among the five leads who successfully move through a sales pipeline?
According to recent research, the average Conversion rate across the whole industry that use a sale pipeline stands at 20%.
If you understand this benchmark properly, you can improve your lead generation and conversion effort more than ever before.
2. Lead Response Time
A study shows that the chance of qualifying a lead can be decreased by 400% if the sales pipeline or website takes a time that exceeds five minutes.
If you can ensure a fast response time that is possible to capitalize on their interest and increase the chances of convection.
3. Sales Cycle Lenght Stats
The length of the sales cycle depends on the type of industry and products you are selling. The Sales Pipeline stats show that the average sales cycle lasts around 84 days.
If you can analyze your sales cycle duration you can identify your potential bottlenecks and streamline your process through the sales pipeline.
4. Sales Pipeline Value
If you are thinking of forecasting and revenue planning, monitoring the total value of opportunities in your sales pipeline is very important.
According to research, companies with accurate sales forecasts achieve 46% higher sales win rates. So it’s important to have a healthy pipeline for sustainable business growth.
5. Sales Pipeline Leakage
The Sales Pipeline leakage means the lost opportunities and revenue potential through the sales process.
A study shows that businesses may lose around 27% of their annual revenue due to pipeline leakage.
So it’s very important to identify the gaps that are essential for maximizing sales performance and business growth.
6. Sales Lead Source Effectiveness
This will help you to allocate your research and investment according to your source of lead.
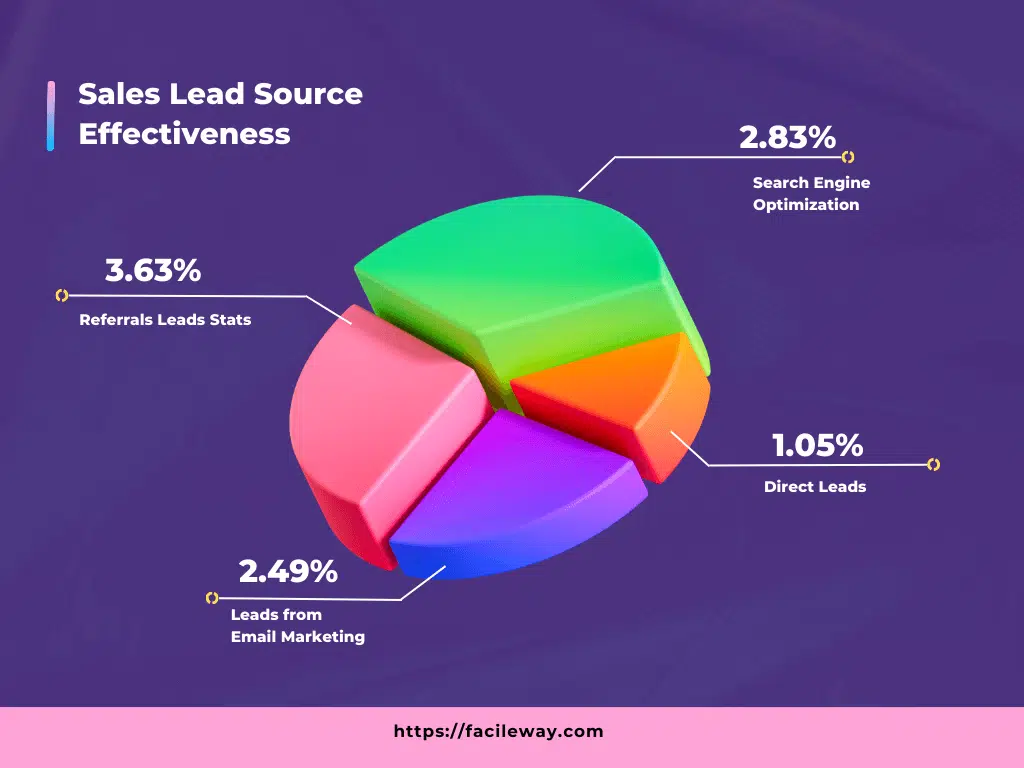
Sales Pipeline Statistics shows that referrals have the highest conversion rate at around 3.63%, Search engine optimization at 2.83% and email marketing at 2.49%.
7. Win Rate by Lead Source
The Win rate by lead sources indicates that email marketing has the highest win rate at 24.79% followed by website leads at 19.27% and referrals at 16.29%.
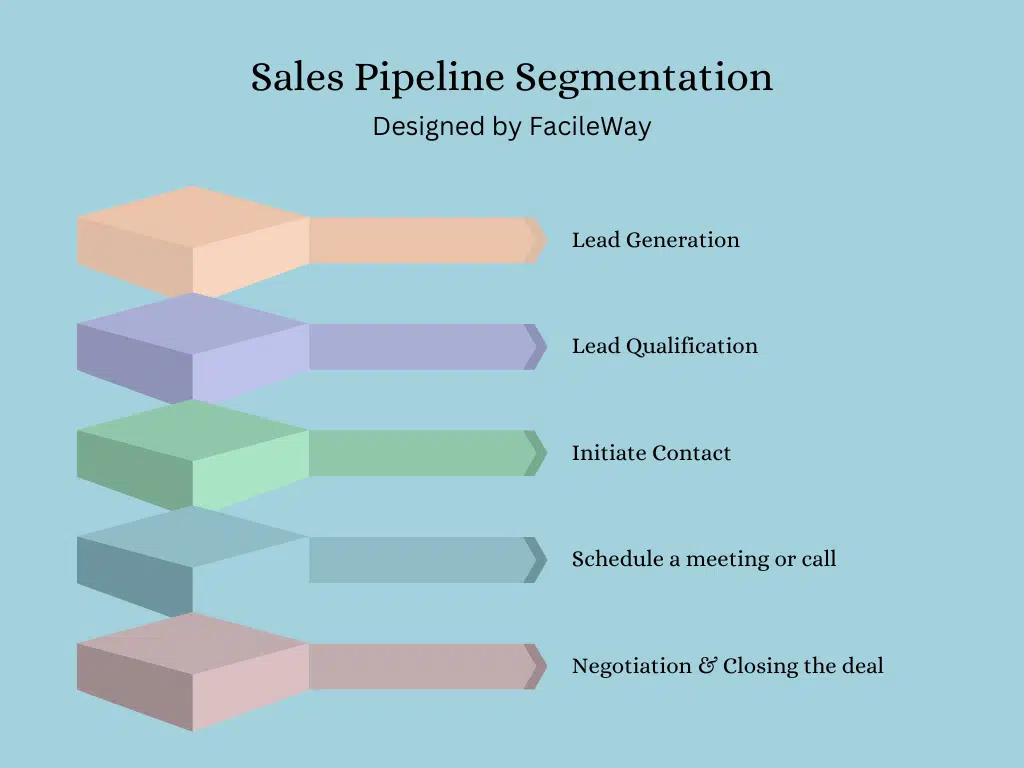
8. Sales Pipeline Segmentation
Segmenting your sales pipeline according to factors such as lead source, industry, or deal size can help you create tailored communication and targeted strategies.
Companies that utilize this method witness a 10% increase in conversion rates compared to those that don’t segment their pipeline.
By organizing your leads into different categories, you can better understand their needs and preferences, which enables you to personalize your outreach efforts.
Segmentation allows you to prioritize leads based on their potential value and allocate resources accordingly.
It also helps in identifying areas where improvements can be made in terms of lead generation and nurturing efforts.
By analyzing the performance metrics of each segment, such as open rates and click-through rates, you can identify areas where there might be room for improvement.
This data-driven approach ensures that your sales pipeline is optimized for maximum efficiency and effectiveness.
9. Sales Pipeline Length by Industry
Sales pipeline duration can significantly differ depending on the industry. For instance, technology and software companies usually experience more prolonged sales cycles due to intricate buying processes that last around 120 days on average.
In contrast, retail businesses tend to have shorter sales cycles lasting approximately 30-60 days.
Being familiar with industry-specific benchmarks is crucial in establishing practical expectations and resource allocation.
10. Sales Pipeline Alignment with Marketing
Effective lead generation and pipeline management require strong alignment between sales and marketing teams.
Companies that successfully align sales and marketing achieve an impressive 20% annual growth rate, while those with poor alignment experience a decline of 4%.
To enhance pipeline performance, collaborating on lead qualification criteria, content creation, and nurturing strategies can significantly improve outcomes.
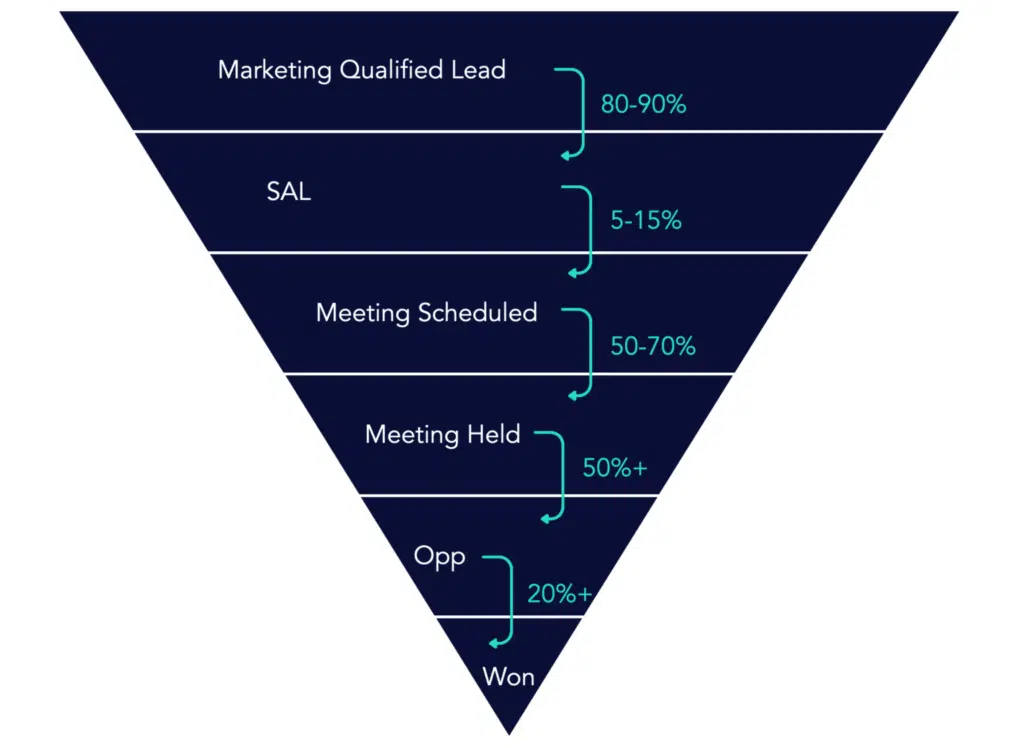
11. Sales Pipeline Benchmark Statistics
Comparing your sales pipeline performance to industry standards is a valuable exercise that helps you pinpoint room for improvement and establish achievable objectives.
For instance, the standard lead-to-opportunity conversion rate stands at about 13%. By evaluating your conversion rate against this benchmark, you can evaluate how successful your lead nurturing and qualification techniques are.
12. Sales Pipeline Follow Up Statistics
Maintaining a consistent and timely follow-up is essential to ensure the steady advancement of the sales pipeline.
Studies have revealed that an impressive 80% of sales necessitate a minimum of five follow-up calls subsequent to the first meeting.
Nevertheless, it is concerning that 44% of sales experts abandon their efforts after just one follow-up.
By giving due importance to follow-up responsibilities and adopting proficient nurturing methods, you can optimize lead prospects and boost conversion rates.
13. Impact of Upselling and Cross-selling
Expanding customer relationships through upselling and cross-selling is a highly effective approach to boosting revenue and optimizing your sales pipeline.
Studies suggest that there is a 60-70% chance of selling to an existing customer, compared to a mere 5-20% chance of selling to a new prospect.
By prioritizing the identification of upsell and cross-sell opportunities, you can cultivate long-term customer loyalty and fuel further revenue growth.
14. Sales Pipeline Visualization
Utilizing tools such as CRM dashboards or pipeline management software to visualize your sales pipeline can offer a comprehensive outlook on opportunities, stages, and progress.
Studies indicate that businesses that adopt visual pipeline management witness a 27% increase in their win rates.
By having a visual representation, it becomes easier to track, forecast, and make informed decisions, enabling your sales team to prioritize tasks and achieve better outcomes.
21 Fact-Checked Sales Pipeline Stats 2024
Editor’s Pick:
- Typically, the rate at which potential customers are converted into opportunities is approximately 13%. (HubSpot)
- Usually, merely 27% of leads are considered qualified before they enter the sales pipeline. (HubSpot)
- Businesses that have a clearly outlined sales procedure encounter an increase in revenue growth rate by 18%. (Gartner)
- Typically, the process of converting a lead into a deal takes around 84 days. (HubSpot)
- According to statistics, a mere 36.6% of the time spent by salespeople is dedicated to selling.
- By employing social selling techniques, sales representatives have a 79% higher chance of achieving their sales targets. (LinkedIn)
- The vendor who replies earliest has the potential to earn a commission of 35-50% based on their sales.. (InsideSales.com)
- It has been found that a significant 63% of potential customers who inquire about your company’s information today will not make a purchase until a minimum of three months later. (Marketing Donut)
- Businesses that opt for lead management automation witness a surge in revenue by 10% or more within a timeframe of 6-9 months. (Gartner)
- It has been found that a minimum of five follow-ups after the initial contact is necessary for 80% of sales. (The Marketing Donut)
- Out of all the leads, only 25% can be considered authentic and eligible to proceed towards sales. (Gleanster Research)
- Businesses that prioritize lead nurturing generate 50% higher sales while incurring 33% lower costs than those that don’t focus on it. (Forrester Research)
- It has been observed that 44% of salespeople abandon their efforts after just one attempt at follow-up. (Scripted)
- On average, 66% of the time allocated for salespeople is consumed by administrative tasks. (Salesforce)
- Businesses that have a documented sales process experience a 30% increase in sales growth. (Aberdeen Group)
- It is observed that the typical success rate for predicted transactions is approximately 47%. (CSO Insights)
- According to a survey, the majority of buyers (75%) have expressed their preference for personalized offers. (Salesforce)
- Improperly qualified leads contribute to 67% of lost sales by sales representatives. (MarketingSherpa)
- A formal process for identifying their ideal customer profile is present in 58% of high-performing companies. (TOPO)
- Businesses that employ marketing automation for lead nurturing witness a significant rise of 451% in qualified leads. (The Annuitas Group)
- Salespeople are trusted by only 3% of buyers. (HubSpot)
Sources:
Read Other Statistics:
- 25 Mind-Blowing Sales Statistics: Latest Data
- 35 Blogging Statistics You Should Know
- 35 Facebook Stats Every Marketer Should Know
- What is Hubspot and How Does it Work?
- 53 Shocking Amazon FBA Statistics You Should Know
Conclusion
Understanding your sales pipeline statistics helps you make better business decisions and optimize your sales process.
From building a sales pipeline to forecasting and management, there are key metrics and KPIs that every business needs to track.
By analyzing and optimizing these metrics, you can increase conversions, close more deals, and ultimately boost your sales.
I hope you have loved this article. Please share with your friends on social media like Facebook, Twitter and LinkedIn.
![How To Become A Good Content Writer [Effective Tips]](https://facileway.com/wp-content/uploads/2022/01/How-To-Become-A-Good-Content-Writer-Effective-Tips-768x432.png.webp)